Full list of police officer numbers in England and Wales, by force
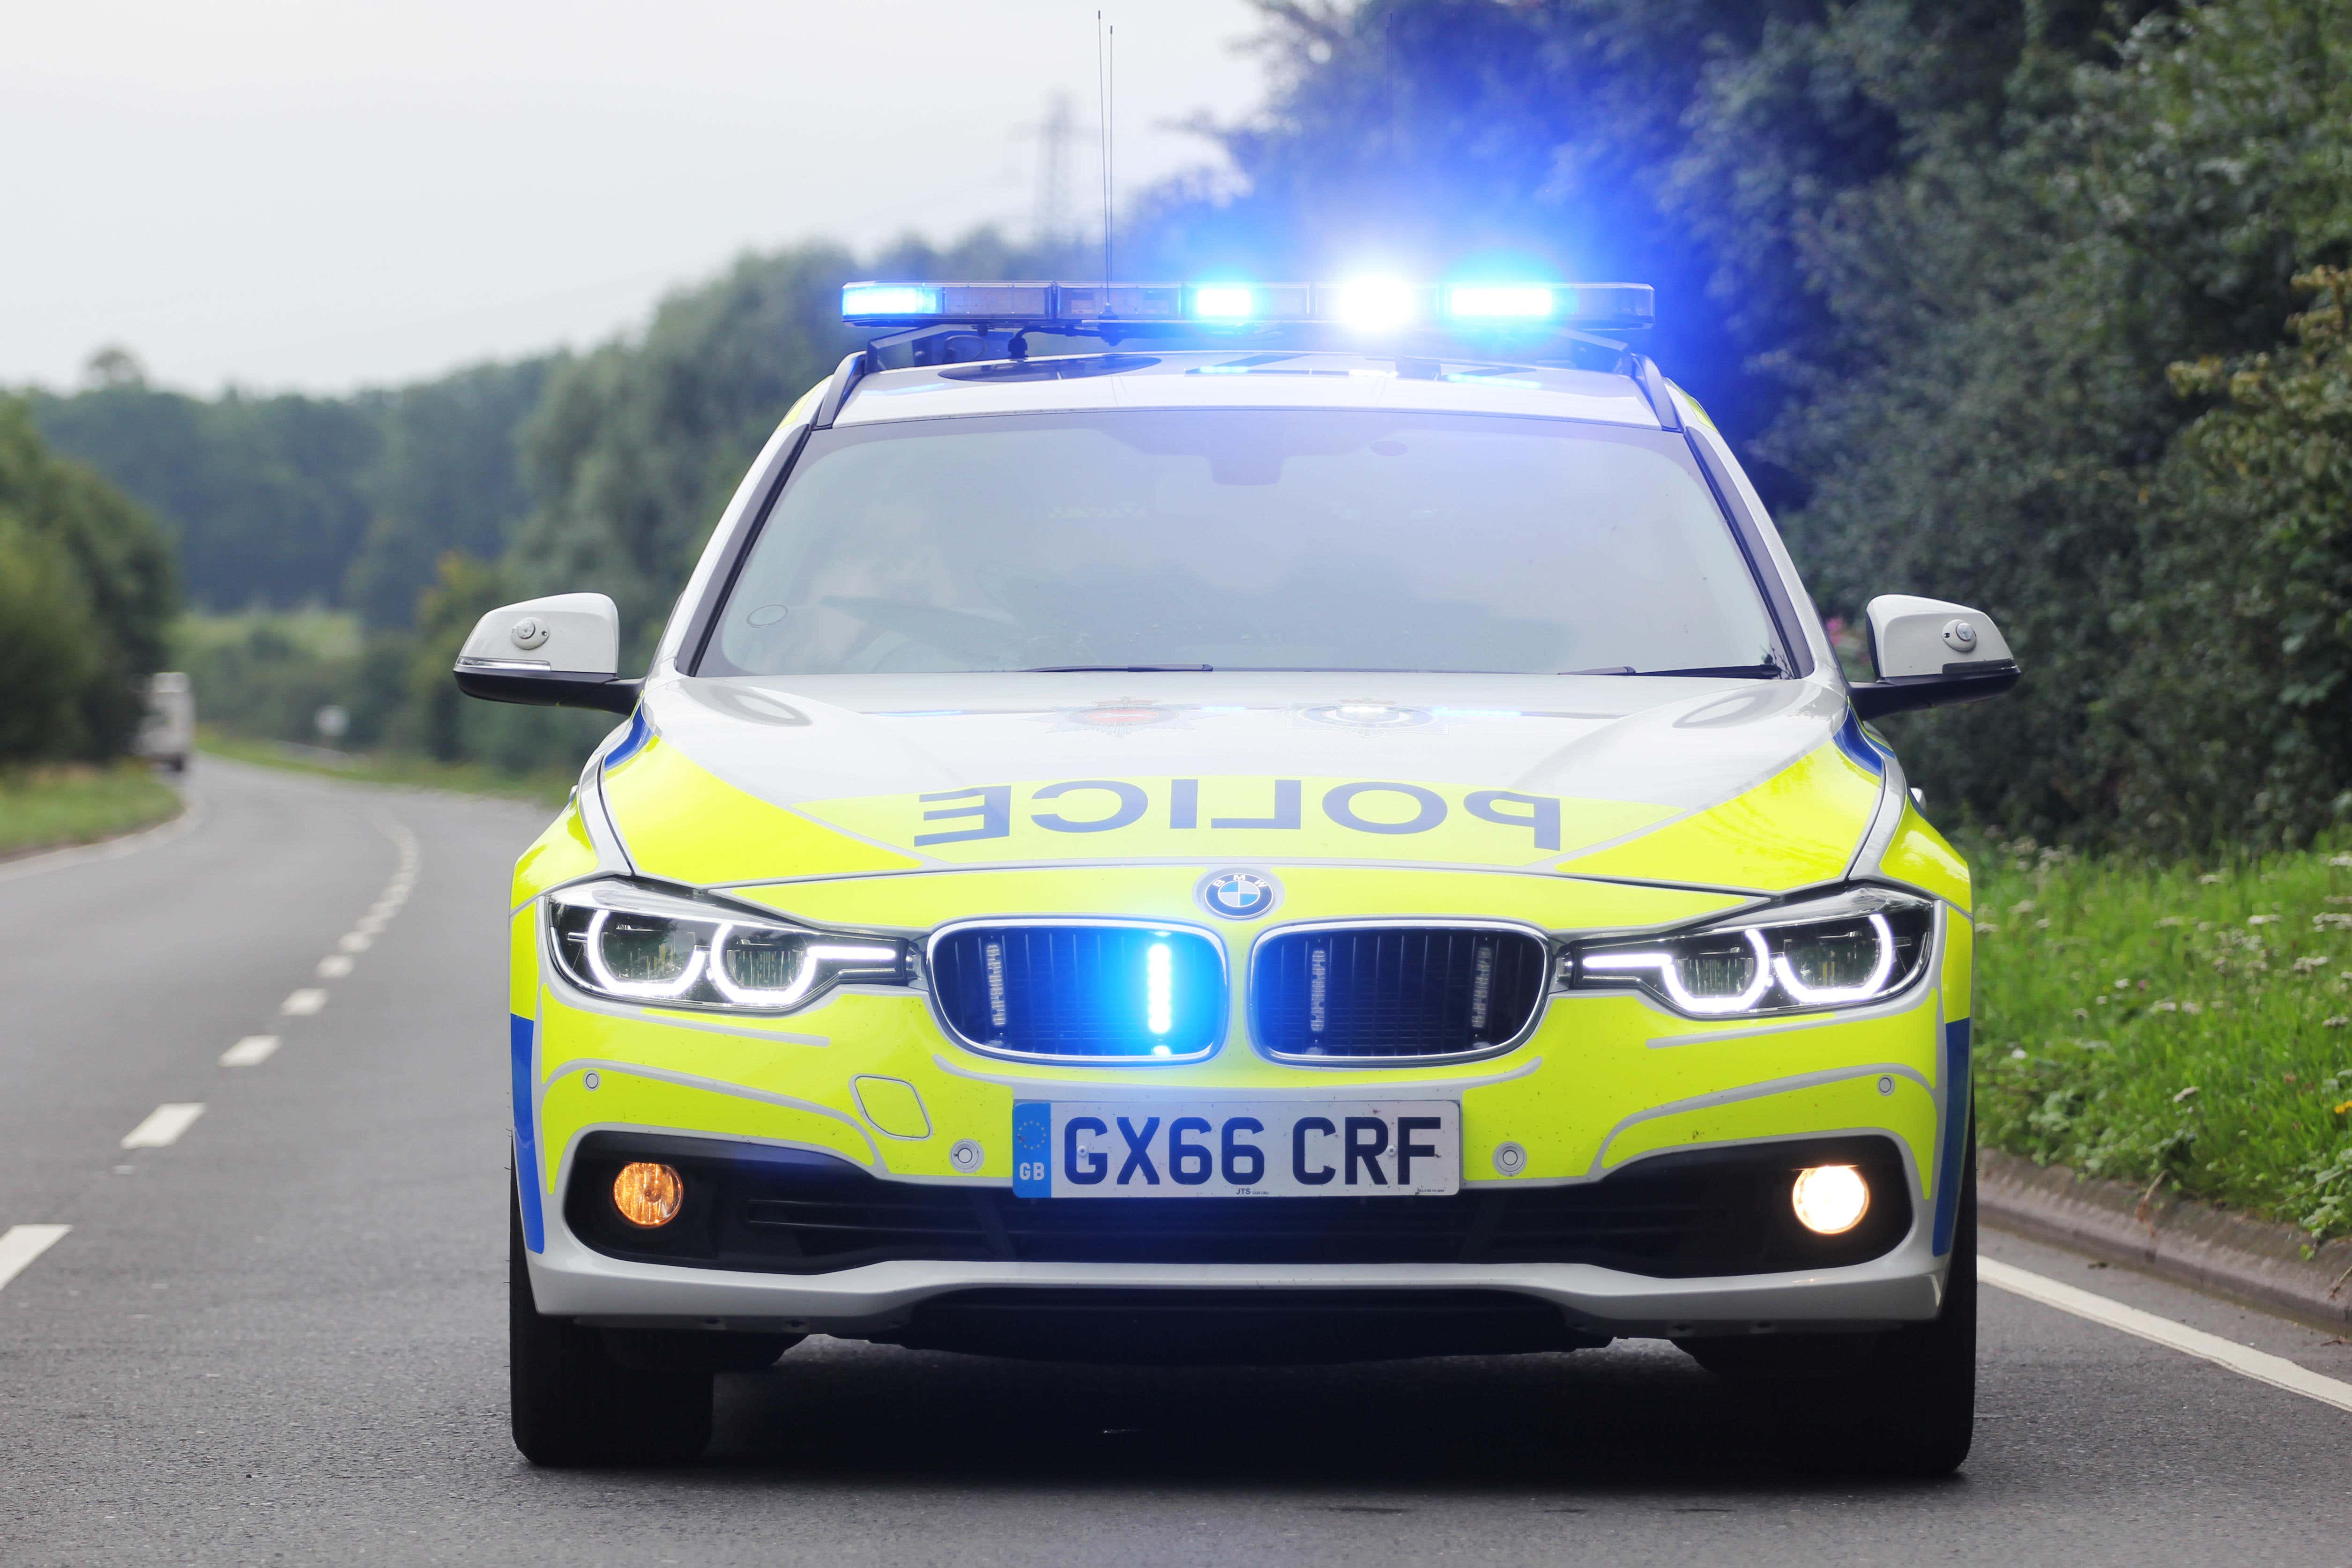
The Metropolitan Police saw the largest drop in officers in the latest year, down 1,022 from 34,315 to 33,293.
Here is a breakdown by force of the latest number of police officers in England and Wales, along with the year on year change.
The figures have been published by the Home Office and show the full-time equivalent (FTE) number of officers per force as of March 31 2025.
Of the 43 forces, more than half (27) have seen a year-on-year fall in officers, with the Metropolitan Police recording the largest percentage drop (down 3.0%), followed by Humberside (down 2.5%), Hertfordshire (down 2.3%) and Wiltshire (down 2.2%).
The Metropolitan Police saw the largest numerical drop in officers, down 1,022 from 34,315 to 33,293.
Some 15 forces saw an increase in police officers, with Gloucestershire recording the largest percentage rise (up 2.9%), followed by Bedfordshire (up 1.6%), Gwent (up 1.3%) and Cheshire (up 1.1%).
The total number of FTE officers across the 43 police forces stood at 146,442 at the end of March 2025, down 1,303 or 0.9% from 147,745 a year earlier.
The list is arranged alphabetically and gives the name of the force followed by the number of FTE officers as of March 31 2025, then the numerical (and percentage) change on the number of FTE officers on March 31 2024.
Avon & Somerset: 3,327; up 33 (1.0%) from 3,294Bedfordshire: 1,481; up 23 (1.6%) from 1,458Cambridgeshire: 1,720; down 27 (-1.5%) from 1,747Cheshire: 2,395; up 27 (1.1%) from 2,368City of London: 992; down 3 (-0.3%) from 995Cleveland: 1,520; up 6 (0.4%) from 1,514Cumbria: 1,365; down 18 (-1.3%) from 1,383Derbyshire: 2,102; down 21 (-1.0%) from 2,122Devon & Cornwall: 3,618; down 13 (-0.3%) from 3,630Dorset: 1,420; down 21 (-1.4%) from 1,441Durham: 1,376; up 11 (0.8%) from 1,365Dyfed-Powys: 1,291; down 3 (-0.2%) from 1,294Essex: 3,760; down 3 (-0.1%) from 3,763Gloucestershire: 1,346; up 38 (2.9%) from 1,308Greater Manchester: 8,112; down 29 (-0.4%) from 8,141Gwent: 1,549; up 21 (1.3%) from 1,529Hampshire & Isle of Wight: 3,370; down 15 (-0.4%) from 3,384Hertfordshire: 2,379; down 55 (-2.3%) from 2,434Humberside: 2,273; down 57 (-2.5%) from 2,330Kent: 4,168; up 1 (0.01%) from 4,167Lancashire: 3,561; down 17 (-0.5%) from 3,578Leicestershire: 2,248; no change (0%) from 2,248Lincolnshire: 1,173; down 24 (-2.0%) from 1,198Merseyside: 4,159; down 14 (-0.3%) from 4,172Metropolitan Police: 33,293; down 1,022 (-3.0%) from 34,315Norfolk: 1,911; up 15 (0.8%) from 1,896North Wales: 1,736; up 16 (1.0%) from 1,720North Yorkshire: 1,655; down 25 (-1.5%) from 1,681Northamptonshire: 1,465; down 22 (-1.5%) from 1,487Northumbria: 3,829; down 16 (-0.4%) from 3,845Nottinghamshire: 2,391; down 28 (-1.2%) from 2,419South Wales: 3,511; down 22 (-0.6%) from 3,533South Yorkshire: 3,026; down 47 (-1.5%) from 3,073Staffordshire: 1,997; down 16 (-0.8%) from 2,013Suffolk: 1,403; up 3 (0.2%) from 1,400Surrey: 2,330; up 18 (0.8%) from 2,312Sussex: 3,206; up 22 (0.7%) from 3,184Thames Valley: 5,000; down 50 (-1.0%) from 5,050Warwickshire: 1,131; up 5 (0.4%) from 1,126West Mercia: 2,509; down 4 (-0.2%) from 2,513West Midlands: 7,991; down 9 (-0.1%) from 8,000West Yorkshire: 6,138; up 65 (1.1%) from 6,073Wiltshire: 1,213; down 28 (-2.2%) from 1,240
Bookmark popover
Removed from bookmarks